Do you know how Kretaro reached 1,50,000+ registered users? If not, don’t worry. This blog will tell you everything about it! We are really happy because our growth has accelerated a lot and we’ve reached 1,50,000+ registered users. We started by testing some hypotheses in order to reach this big number of users.
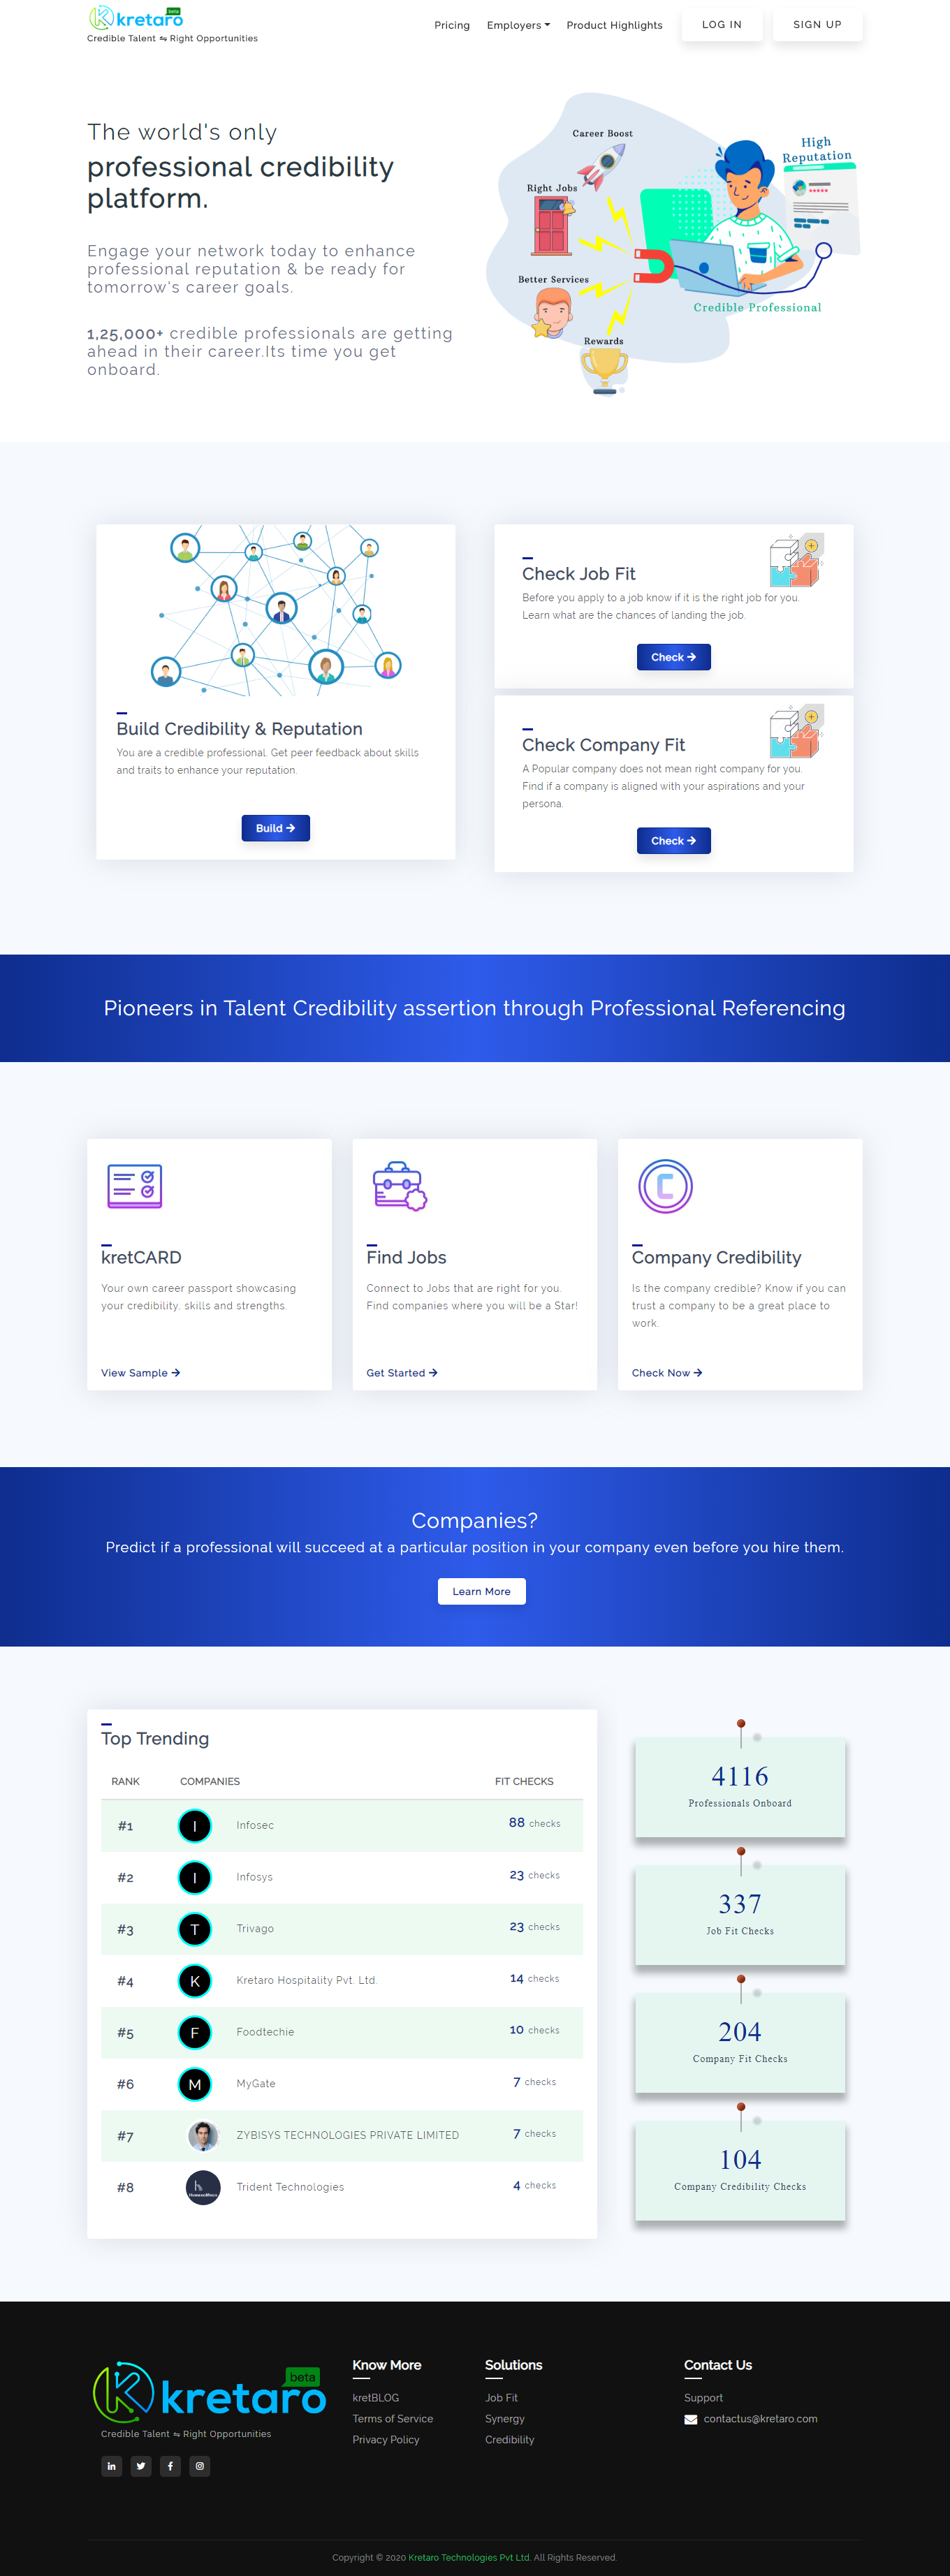
Before I tell you about our success story, let me introduce you to Kretaro. Kretaro is an employment credibility platform where credible talent meets the right opportunities with trust. Kretaro has already helped many recruiters and professionals to easily trust each other. With a vision to enable every individual to connect with right opportunities with trust, we are trying our best to achieve that and helping many entities.
The journey was certainly filled with surprises, surprises that I want to share.
tl;dr
We started collecting leads from October 2019, and by November 2020, we had 154,000+ users.
Not much money on ads. Nothing fancy so far.
We didn’t just Google how to market our app because most of the people are trying the same sh*t again and again — it doesn’t work at all. Instead, we gave it a proper thought and discovered some untapped ways of marketing.
We leveraged everything from public Facebook groups, WhatsApp groups, and forums like Quora to content marketing and some social media ads.
Results were slow but… this is what you get in meager $2500 marketing budget. 😁 And, it really adds up in the long run.
154,000+ users. Not bad, right?
We released the website in December 2019.
The marketing marathon starts…
In October 2019, we decided to collect leads and ask people to join the early bird list and signup for our MVP.
It all started with a simple landing page.
Channels we leveraged
We didn’t just go for some common marketing tactics; we brainstormed, discussed, and discovered some untapped ways. But we were not sure about the ROI.
Following are the platforms and channels that we leveraged:
Groups
Facebook Groups
We were already aware that engagement in the public Facebook groups is almost close to nothing.
But, we started posting interesting infographics & creative posts there; engagement was less but we continued.
To our surprise, slowly-slowly people started recognizing our brand and we saw some (literally, just some) traction — we continued the same for months.

It was giving us slow… very slow but steady signups.
In the process we have collaborated with 121 Facebook groups for a long-term partnership:
- Free = 63
- Paid = 58 (Costing: $408)
Criteria we followed to select groups for collaboration
- Members: >100,000
- Niche: Career, Self Improvement, Startups, Local groups
- Geography: 2 Groups per state in India
- Engagement: 30+ likes on the first 5 posts of ours and in general have active participation(likes, comments, shares) of members on other posts.
- Content: Must have policy go through the approval process, not open for all. Fewer spam posts.
- 630 groups joined
- 15-20 group posts every day
- 50-80 per day visitors
WhatsApp & Telegram Groups
We agree that it was much like spamming but we found a bunch of WhatsApp and Telegram groups from Google & known contacts, joined them, and started posting on a regular basis.
We all know that some random messages in those groups are totally ignored. Nobody cares unless it’s interesting.
We took the proper time to design infographics and post them in those groups. It was working, signups were increasing. We continued the same for 5-6 months.
We also have collaborated with 68 Whatsapp groups & 17 telegram groups for a long-term partnership:
- Free = 48 WhatsApp + 4 Telegram
- Paid = 20 WhatsApp (Costing: $77.50) + 13 Telegram (Costing: $46)
Criteria we followed to select groups for collaboration
- Members: >200 for WhatsApp, >10,000 for telegram
- Niche: Career, Personality, News, Indian startups
- Engagement: Members engaged in a consistent manner. Relevant posts to the group niche.
- 476 WhatsApp & Telegram Groups Joined
- 25-40 Group PostsEveryday
- 9:00-10:30 PM Best Posting Time Analyzed
However, we couldn’t properly track the traction that we got from WhatsApp. But… after we posted in those groups, a lot of visitors used to show up on our analytics. We assume all were from the WhatsApp and Telegram groups.
LinkedIn & Reddit Groups
We did try to leverage LinkedIn groups and Sub-reddits but not much success with them. A lot of time and effort was put into but it returned unsatisfactory results.
We skipped LinkedIn and Reddit.
Social platforms
We were consistent on Pinterest through an IFTTT automation but were unaware of the results for the first 4 months, we were never checking the insights.
One day, Pinterest sent an email that they have launched a new version of the analytics.
We clicked, and to our surprise, there were 35K impressions on Pinterest. Most of them were from the US but the audience is the audience.
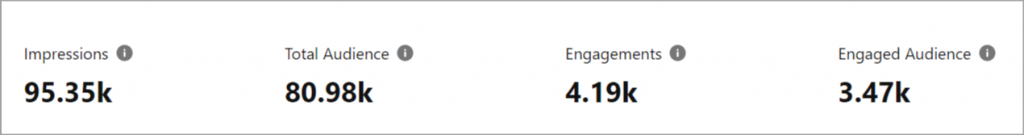
On Pinterest, we got the Most Impressions on
Mondays & Tuesdays
The best conversion rate of all – we established a personal connection using Instagram Direct.
We sent a welcome message to everyone who followed us on Instagram, educated them about Kretaro, and asked them to sign up in the end.
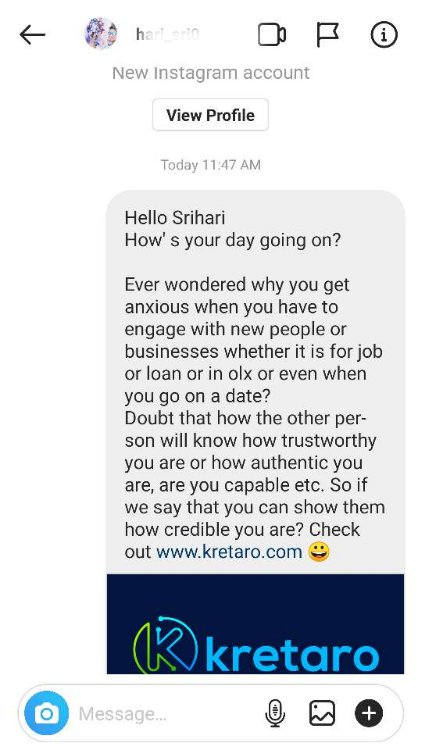
We have used almost 15-20 versions of messaging.
We used bit.ly to keep track of the visits from the bio and DM. We got less traffic but of very high quality as compared to Facebook.
It was manual and tedious but conversions are guaranteed when personalization touches the communication.
Instagram Traffic had almost
50% Conversion Rate
Tiktok
It’s undeniable that TikTok was experiencing a phenomenal rate of growth before getting banned in India. We thought to try our luck on TikTok too. 😸
We uploaded 7 videos which generated only a few 1000’s views in total with zero clicks.
After that, we collaborated with an influencer friend to post a video. The deal was simple — we would make a good-looking resume for her and in return, she will post a video about Kretaro.
We purchased 2 good-looking resume templates for $32, put in all her details there and she posted a video. The video generated 10K+ views and 200+ likes.
Not sure, if any signups though.
Paid Ads
Instagram & Facebook Ads
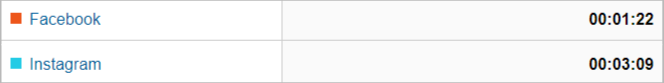
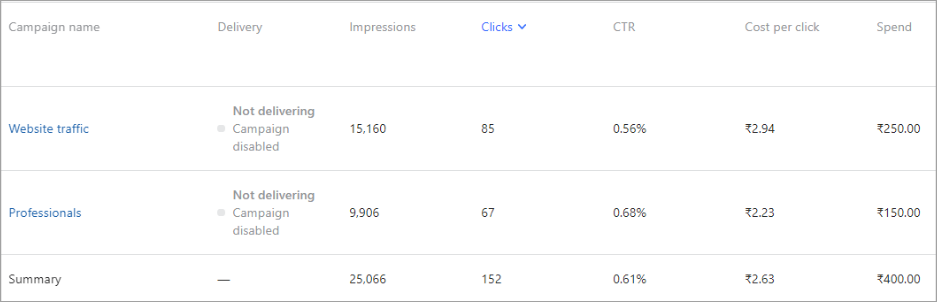
We spent $485.90 on ads on Facebook & Instagram, mostly during the initial days.
We started with both Facebook and Instagram but stopped Facebook because of some probable bugs in the ads. All of a sudden Facebook started sending irrelevant traffic and the bounce rate went up to 65-80% from 25-32%.
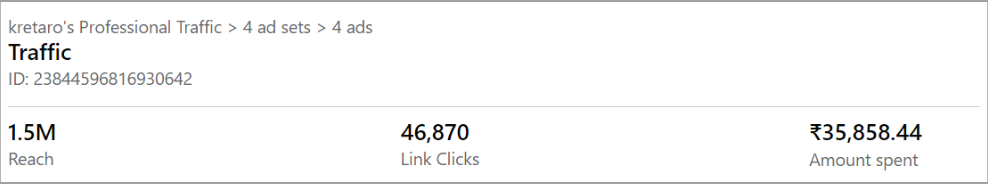
However, we stayed with Instagram ads for a few months.
- $0.012 Cost per Click
- 46870 Link Clicks
- $0.11 Cost per Acquisition
Linkedin Ads
We are not touching LinkedIn ads again, at least in the near future.
We selected the target audience and published the ads with a spend of $8.13 per day. After creating the ad at 11:15 PM, we submitted it for review and thought it will start the next day.
But… within 30 minutes, $8.13 was gone with just 9 clicks as per the LinkedIn analytics. However, Google Analytics showed just 1 click from LinkedIn ads. 🙂
$8 for 1 click? No, our budget wasn’t that high.
- $8.13 Spent
- 9 Clicks
- $5.58 Average CPM
- $0.90 Average CPC
Quora Ads
We were trying Quora Ads for the first time, and no one on the team had any idea about it. We tried and got some results though.
- $5.42 Amount Spent
- $0.036 Cost per Click
SEO
Organic Search
The organic search got us almost 20K visitors. But most searched terms were the just brand name itself Kretaro, Kretaro technologies, etc.
On-Page SEO
For the first 6 months, the bounce rate was too high – up to 57%. People were just coming and dropping away.
We used Hotjar to track users’ behavior and found out that the page load time is high and visitors just come and go, especially on mobile devices.
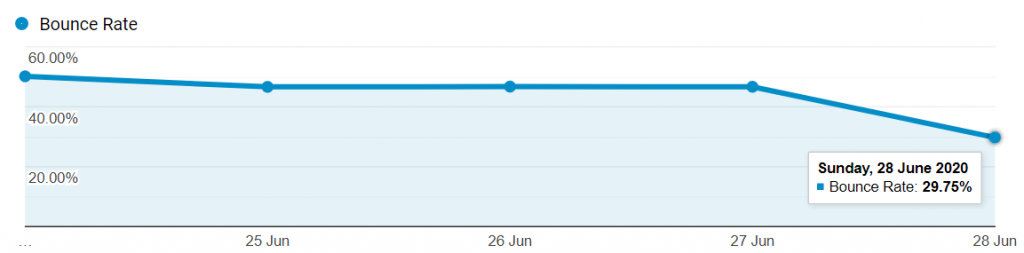
With proper on-page optimizations and by reducing the page size from 2.1 MB to 638 KB, not only the bounce rate start to go down but also the average session duration increased.
The Flywheel Effects
Direct Referrals
Recommendations and direct referrals were the biggest of all.
We introduced a feature for aggregating reputation – people inputs. And, allowed users to ask for feedback about their skills & work style from friends, colleagues, managers, or (and) teachers.
This got us plenty of early users and it kinda worked like a network.
- 2958 People asked for recommendations from friends and colleagues
- 7514 Onboarded via recommendations
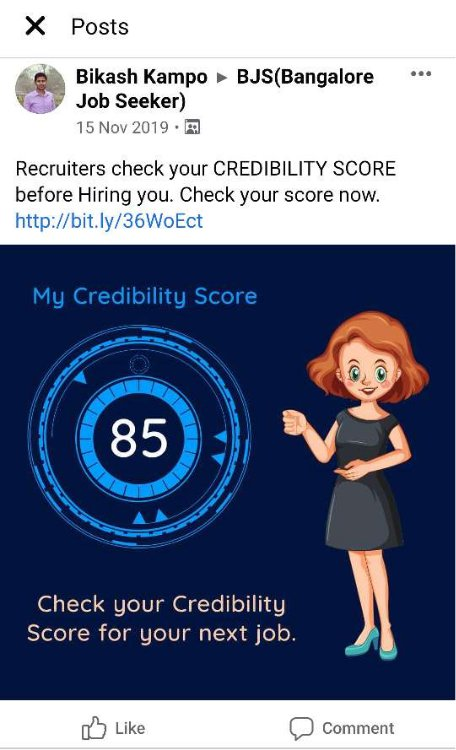
Credibility Checks
We built a way for people to check their credibility score.
Also, invited some known recruiters to use the tool to check the credibility of professionals – they loved it.
However, we couldn’t keep track of the individuals that were on-boarding but a lot of users came to the website directly.

These users can be from the credibility check tool, WhatsApp & Telegram groups, or from the recommendations and feedback that people asked.
Other expenses
- Ahref tool = $10 (For SEO)
- Vibemail = $27.20 (For email outreach)
- WordPress theme Pro = $20
- Gravit Designer Pro = $41.20
- Contest = $176 (Month of January)
- Intern = Data intern: $244.79 (For collecting data related to marketing needs) + Digital Marketing intern: $271.99 + Graphic intern: $68
- Miscellaneous: $570
Some facts
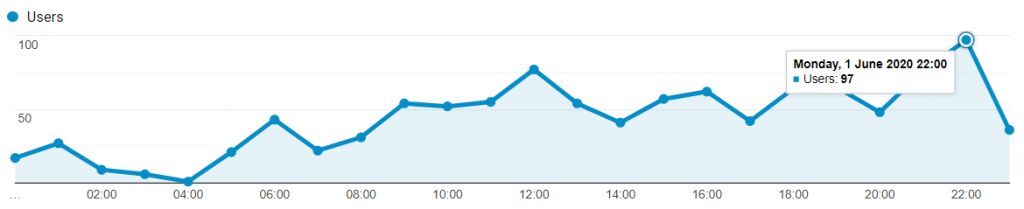
A few times, we did get a few 100’s of real-time active users on the website, most probably from a combination of WhatsApp and Facebook group posts.
Our all-time high was 768 users in real-time.
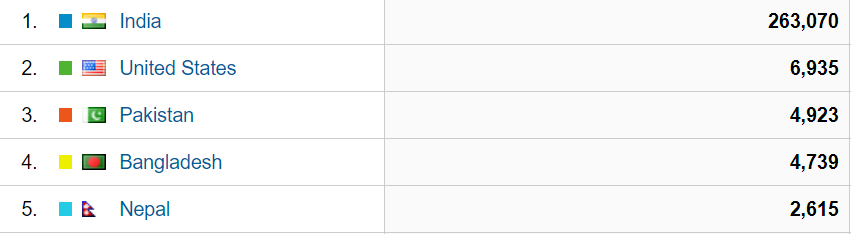
Unknowingly, we became global.
We have website visitors from 231 countries & 2138 cities.
From all the above-mentioned platforms, we were getting signups but, sadly, we weren’t able to measure which platform helped us more WhatsApp groups, FB groups, or forum postings.
Let’s play with numbers
- $2500 amount spent
- 154,000+ early subscribers
- 1,334,735 page views
- 24,789 newsletter subscribers
- 8,000 social media followers
- 206 community collaborations
- 2 partnerships
- 1 media mentions
Tools we used
- Analytics: Google Analytics, Hotjar
- Tracking: Facebook Pixel, Quora Pixel, Bit.ly
- Reports: Google DataStudio
- Design: Figma, Canva, Gravit Designer, Adobe Illustrator, Visme
- Video Editing: Adobe Spark, FlexClip, InShot
- SEO: Google Search Console, UberSuggest, GTmetrix, Moz, Ahref, Screaming Frog
- Email: Mautic, Mailchimp, G-Suite, Vibemail
- Newsletter: Substack
- Blogging: WordPress, Medium
- Writing: Grammarly, Hemingway
- Landing Pages: Hubspot, Elementor with WordPress
- Managing: Notion, Trello, Google Drive
- Automation: IFTTT, Hootsuite
- Chat: Hubspot, MobileMonkey
- Browser Extensions: Eye Dropper, WhatFont, Grammarly, MozBar, Lighthouse
Learnings
Here’s what I’ve learned from this marketing marathon:
- Get your MVP live ASAP.
- Always have a proper goal set up in Google Analytics for better tracking.
- Content is the king.
- Personalization is the key.
- A 0.1-second increase in loading speed can increase conversions by 1%, at least.
- Newsletters are the best way to keep current users engaged.
- Don’t do what everyone else is doing.
- Take regular feedback from users.